Gantt Chart: The Ultimate Guide
Guide


Table of Contents
Share This Article

Projects, whether big or small, are not easy to manage. It's like navigating an unknown city without a map. This may create confusion and can turn chaotic. And to solve this issue, Gantt chart steps in, which is a visual roadmap that simplifies complex projects and enhances project management.
Gantt chart was originally developed by Henry Gantt in the early 20th century. It is a useful tool for project planning and execution, as it provides a clear overview of the various tasks involved in a project and their interdependencies all can be explored with PMP boot camps.
Whether a project manager has to manage projects related to construction, software development and event planning, Gantt charts help the teams stay aligned, track project performance and meet the deadlines effectively.
This guide will help in understanding the detailed ins and outs of Gantt chart and how one can make the most of it for their own effectiveness.
What is a Gantt Chart?
Gantt charts are one the most essential tools of project management. These charts help in offering a visual roadmap or a timeline of the tasks and milestones throughout the project life cycle. They basically give overview of the project tasks. Gantt charts help you in seeing the big picture, identify potential bottlenecks, and also make necessary changes to meet deadlines.
For those preparing for PMP, understanding and interpreting the Gantt chart is the utmost necessity. The ability to break down a project into structured phases, allocate resources, and manage dependencies align directly with the project management principles.
Types of Gantt Chart
Gantt chart is one of the vital tools for project managers and their team which helps in visualizing the tasks of the project.
Some of the common types of Gantt charts are:
Bar Chart: The Traditional Gantt chart
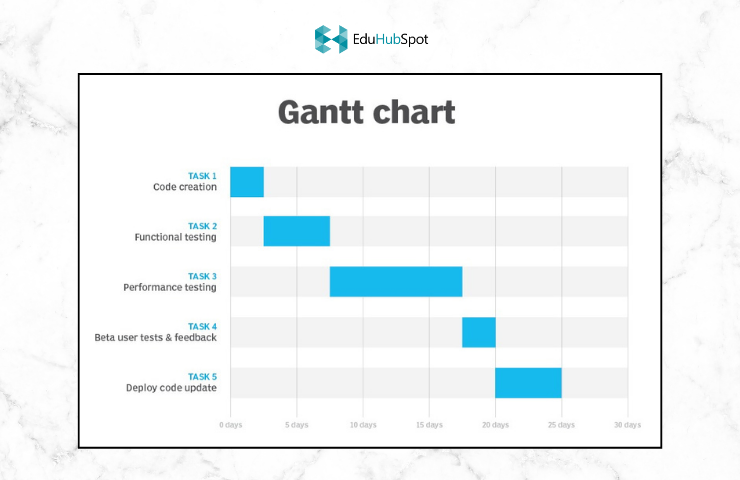
One of the most basic types of Gantt chart is the bar chart which simply shows the tasks of the project through a bar diagram on a timeline. This type of chart works best for the small type of projects wherein there are a limited number of tasks, and this can easily be understood at a glance.
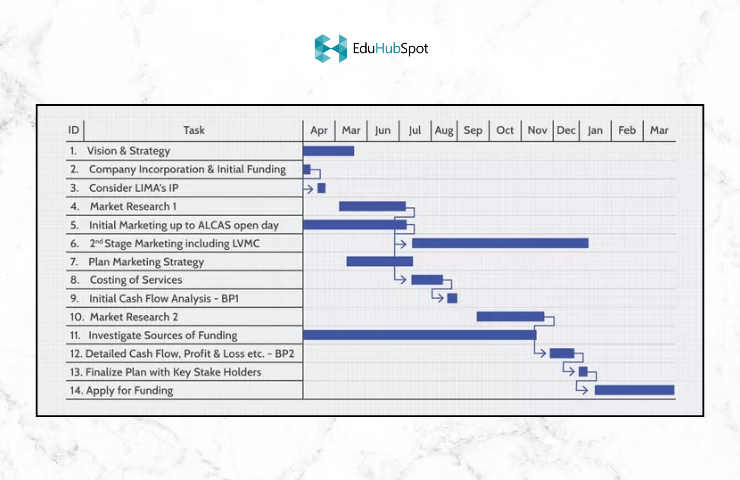
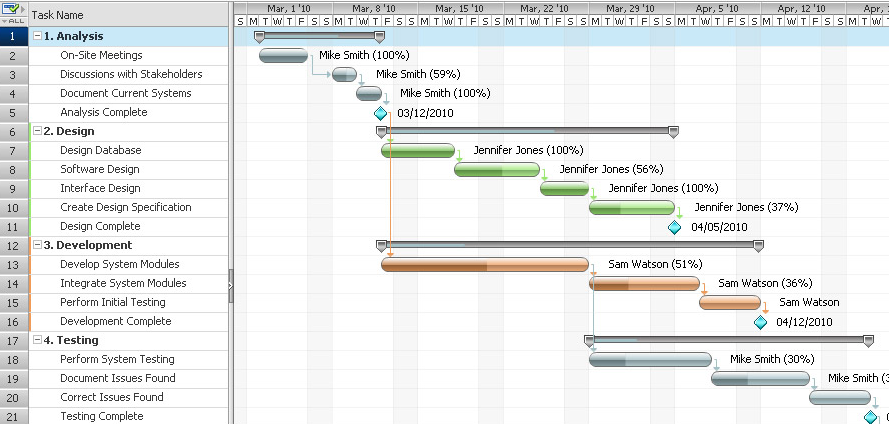
For larger projects with more complex timelines, a Gantt chart is created using the Microsoft software program. This type of chart allows for greater detail which can be looked upon at a glance.
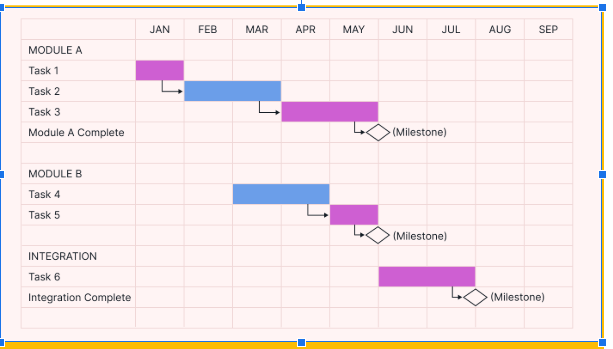
Milestone Gantt Chart
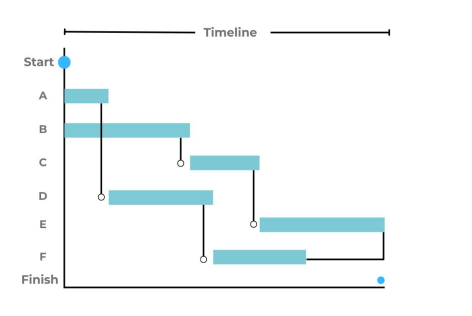
Another type of Gantt chart is the milestone gantt chart which depicts all the achieved milestones of the project rather than every single task. Milestones can be anything like, completion of a phase, approval checkpoints, or major deliverables.
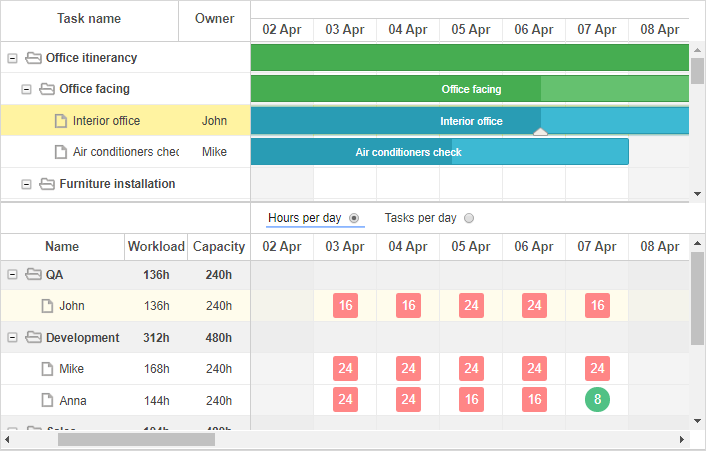
Resource Gantt Chart
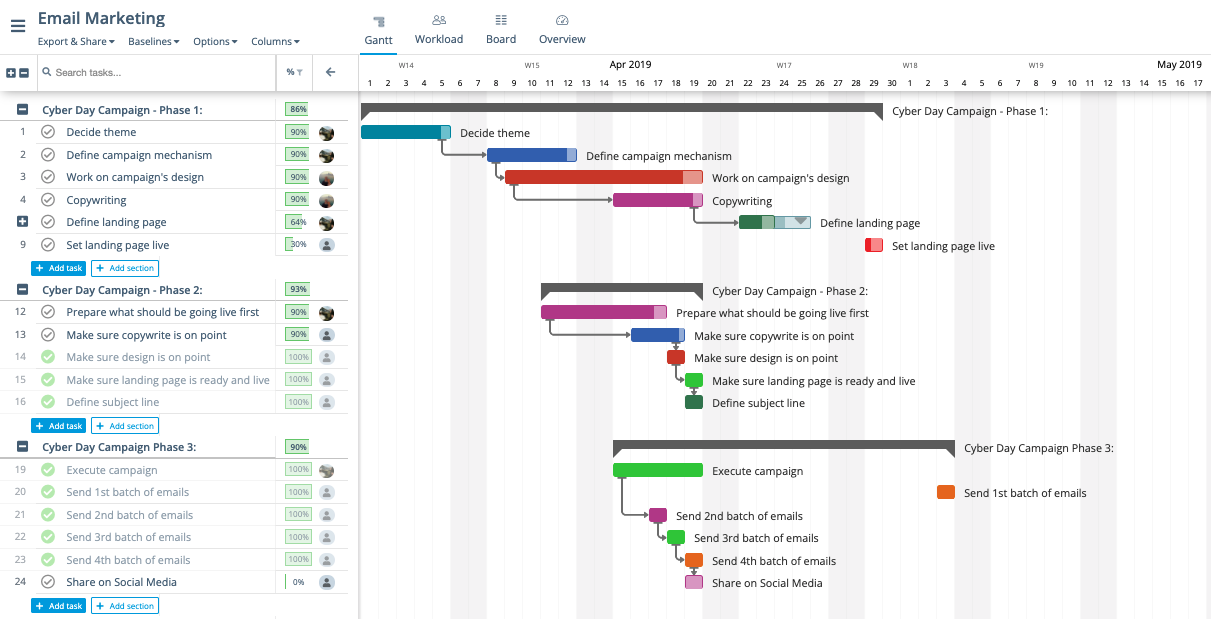
This is another type of Gantt chart where the resources are assigned to a varied set of people. Resources can be inclusive of team members, departments or tools. This helps in ensuring efficient workload distribution and thereby avoiding resource bottlenecks.
What is the Need of a Gantt Chart?
A gantt chart is a useful project management tool that can be used to plan and track the progress of the tasks in a project. When used correctly, Gantt charts can be extremely helpful in ensuring that the projects stay on track and are completed on time.
There are a number of reasons why a Gantt chart is so needed. A gantt chart can ensure that the managers have an idea as to what tasks are left to be completed. This can further ensure that individuals stay on track and don't miss the deadlines.
Furthermore, it helps in clear and transparent communication of project plans to other members of the team. By having a clear and concise view of the project, everyone in the team will be able to understand what needs to be done and when.
Subsequently, this may also help in identifying potential risks in the project. When the managers have an overall look of the tasks left to be completed, it becomes easy to identify the tasks higher on priority and prone to be riskier than others. This way, managers can accordingly plan their course of action.
A well-structured gantt chart can mean the difference between a smooth running project and the one that spirals out of control.
For those looking to sharpen their project management skills and conquer the PMP exam, a structured training program can make all the difference. Consider enrolling in the PMP training course and master essential skills like Gantt chart.
How to Create a Gantt Chart?
In order to create the Gantt chart, a project management software tool is needed. Although there are many options available, one can choose the one that suits the best. Once the software tool is chosen, following steps are needed to create a Gantt Chart.
- Define the project tasks. Start by listing out all of the tasks that need to be completed in order to finish the project.
- Assign a duration to each task. Estimate how long each task will take to complete.
- Enter the start and end dates. Make sure to enter realistic dates for when each task should start and finish
- Create the Gantt chart. Most project management software tools will have a built-in Gantt chart function. Follow the instructions in the chosen software to create the chart.
- Adjust the timeline as needed. As the project manager works on their assigned project, they may need to adjust the timeline of their Gantt chart. For example, if a task takes longer than expected to complete, then they will need to update the chart accordingly.
Creating a Gantt chart can help you better visualize your project timeline and ensure that all tasks are completed on schedule.
Conclusion
A well-structured gantt chart is more than just a timeline, in fact, it's the backbone of an organized and well-managed project. No matter the size and complexity of the project, Gantt chart makes things easy for the project managers. This helps in bringing clarity, keeps teams aligned, and also ensures that the deadlines are met. Most of the high performing projects use Gantt charts as one of the essential project management tools.
Enroll today in a PMP training course from a reputed institute, to ensure deep understanding of the project scheduling tools like Gantt charts.
Frequently Asked Questions (FAQs)
1. What is a Gantt chart?
Gantt chart is one of the essential tools of project management. These charts are used to create a visual roadmap for project planning, scheduling and tracking progress.
2. What are the essential elements of a Gantt chart?
Some of the essential elements of a Gantt chart are: tasks, timeline, bars, dependencies and milestones.
3. Can Gantt charts be used for handling complex projects?
Yes, Gantt charts can surely be used for handling complex projects. However, these charts are then created in Microsoft Project, Primavera V6, or other online tools.
4. Are Gantt charts essential in PMP preparation?
Yes, Gantt charts are essential for PMP preparation. Also, it is one of the required tools for management and scheduling of a project. This is a key knowledgeable area for the PMP exam.
Explore Our Latest
Insights

Stay updated with our recent blog posts.
Explore Our
Course Gallery

Discover a diverse range of courses designed to elevate your skills and knowledge.

